
S
saintmonster• Sep 15, 03:00 AM
c/All About Indices
Nifty India Internet Index – Technical Analysis Price Action & Trend - The ...
Enlarge Chart
Nifty India Internet Index – Technical Analysis
Price Action & Trend
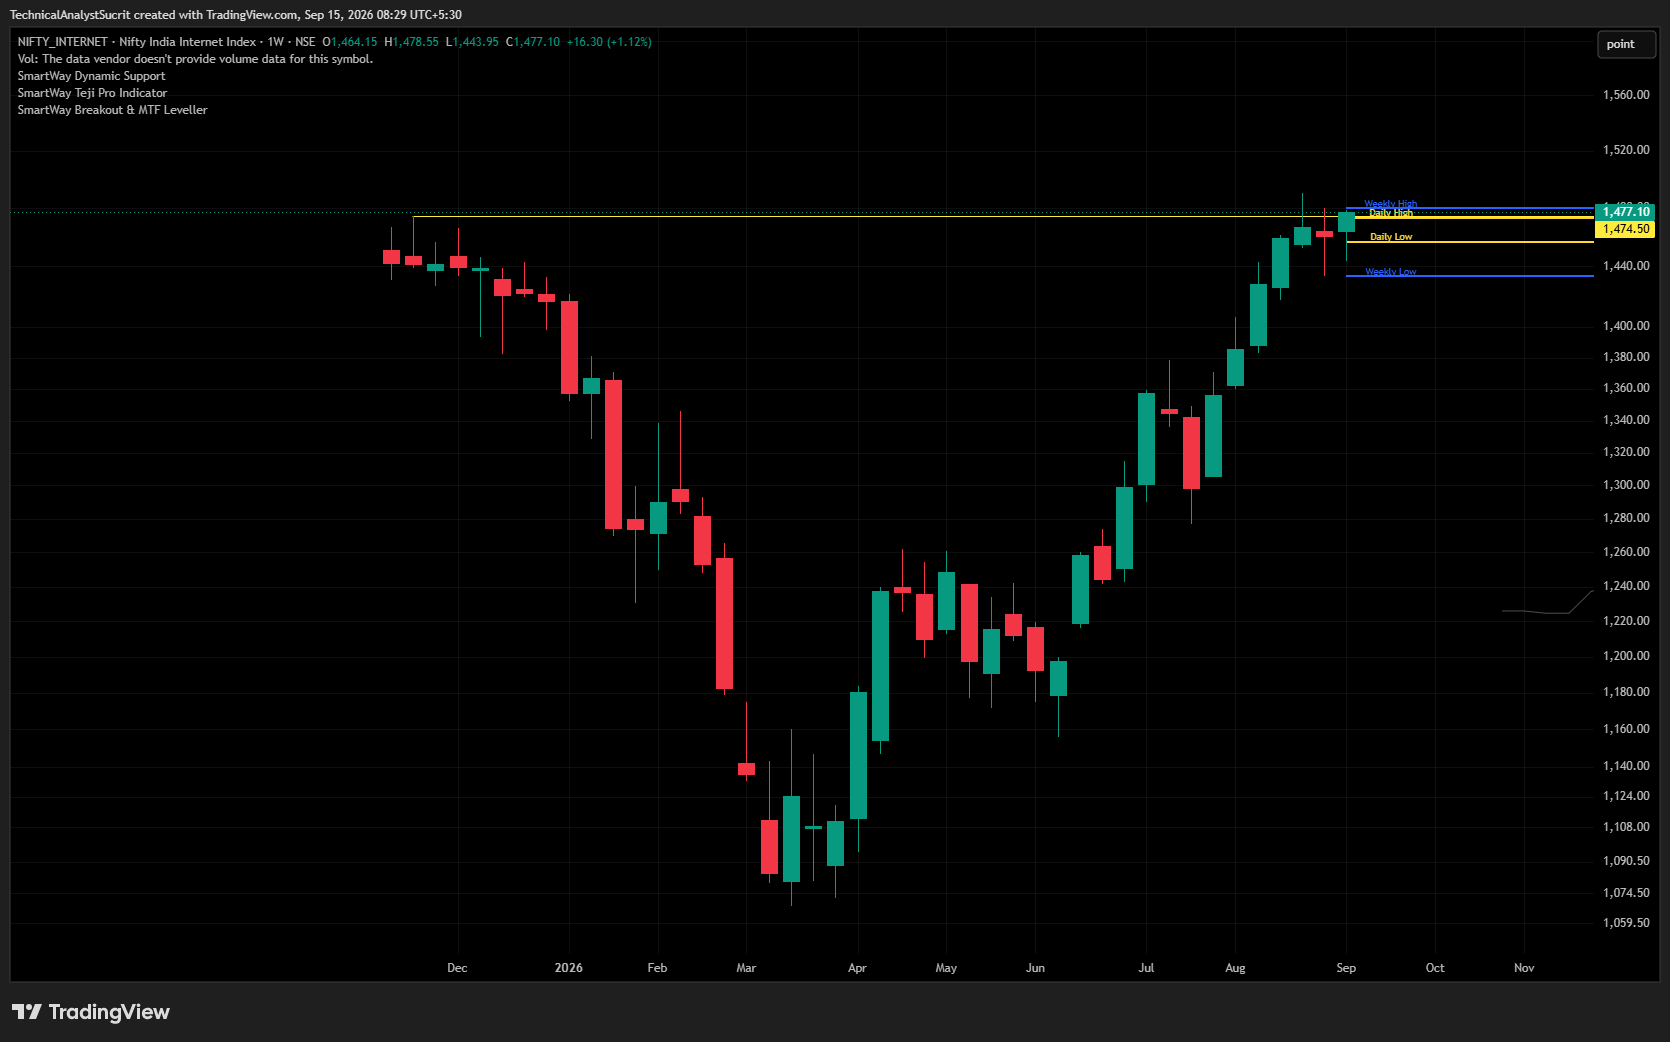
- The index has shown a strong recovery since early 2026, with consecutive bullish weekly candles.
- Current weekly close at 1,477.10 is very near the weekly high of 1,478.55, suggesting buyers are in control.
- The higher highs and higher lows pattern confirms an ongoing uptrend.
Key Levels
- Resistance Zone: 1,478–1,480 (weekly high). A breakout above this level could open room for further upside.
- Support Zone: 1,443–1,445 (weekly low). Holding above this zone keeps the bullish structure intact.
- Daily Low: 1,474.50 acts as immediate intraday support.
Indicators (SmartWay Suite)
- SmartWay Dynamic Support: Price is respecting support levels, showing strength in trend continuation.
- SmartWay Teji Pro Indicator: Likely flashing bullish momentum signals, aligning with the breakout attempt.
- SmartWay Breakout & MTF Leveller: Confirms multi‑timeframe breakout potential near 1,478.
Technical Outlook
- If price sustains above 1,478, next upside targets could be 1,495–1,510 in the short term.
- Failure to break 1,478 may lead to consolidation between 1,445–1,478.
- Trend remains bullish unless weekly close falls below 1,443.
Sentiment & Strategy
- Bullish Bias: Traders may look for long entries above 1,478 with tight stop‑loss near 1,474.
- Risk Management: Watch for false breakouts; weekly close confirmation is key.
- Medium‑Term View: Internet sector strength suggests continued momentum, but overextension near resistance could trigger profit booking.