
S
saintmonster• Sep 14, 02:50 AM
c/All About Indices
📊 NIFTY 50 | Daily Chart Technical Analysis 📉 The Nifty 50 Index (NIFTY) on th...
Enlarge Chart
📊 NIFTY 50 | Daily Chart Technical Analysis 📉
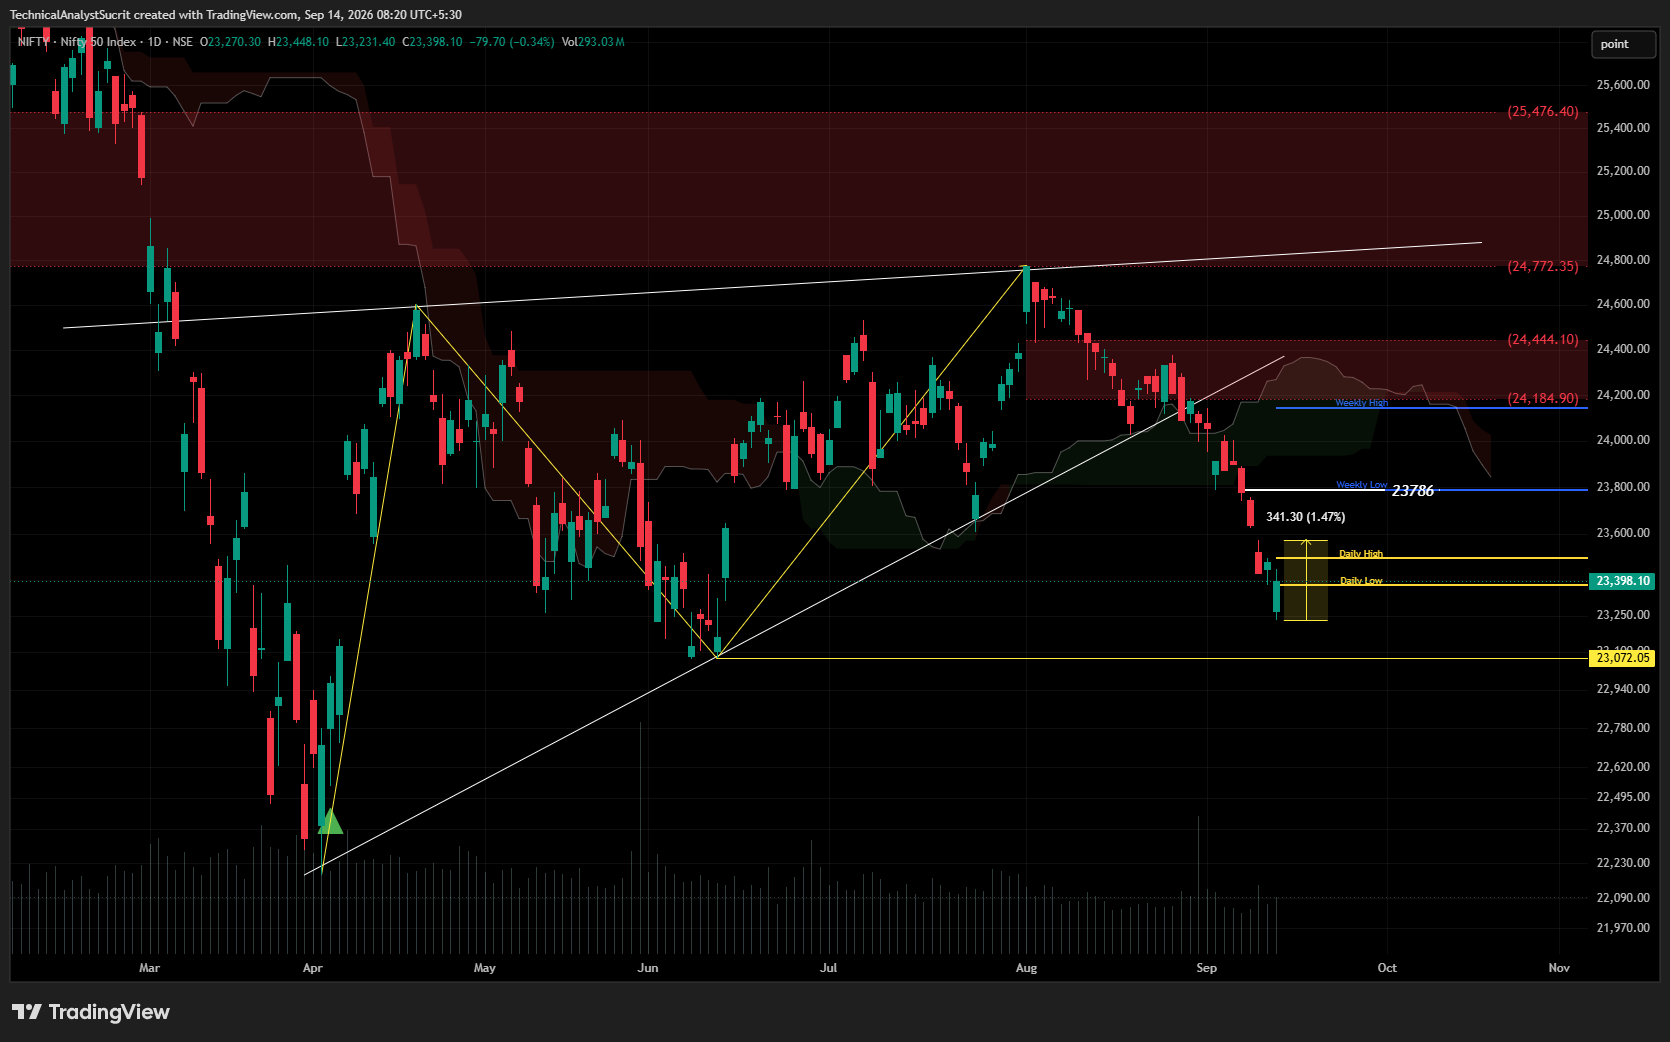
The Nifty 50 Index (NIFTY) on the NSE is demonstrating clear bearish continuation signs on the daily (1D) timeframe, breaking down below critical multi-month trendline support. Here is a breakdown of the key structural developments:
## 📉 Breakdown & Market Structure
* Trendline Violation: The long-term ascending trendline support (drawn from the April lows) has been decisively broken to the downside. The recent pullback retested this broken line as resistance before turning sharply lower.
* Bearish Continuation: The latest daily candle is a strong bearish marquee closing near its low at 23,398.10 (-79.70 / -0.34%), confirming a breakdown below the immediate horizontal floor.
* Measurable Downside: The index has shed 341.30 points (1.47%) in this immediate leg, invalidating previous short-term accumulation theories.
## 🧱 Key Technical Levels
* Crucial Resistance: Immediate overhead supply now rests at 23,786 (previous major swing pivot), followed by the larger cluster at 24,184.90.
* Major Support Zones:
* Support 1: The index is entering an active daily liquidity zone between 23,250 – 23,400.
* Support 2: A critical, historical psychological structure rests at 23,072.09.
## 🎯 Market Outlook
The short-to-medium-term structure remains firmly in control of the bears until Nifty can reclaim the 23,786 pivot on a closing basis. Failure to hold the immediate daily low zone could open the doors for a fast extension toward the 23,072 support pocket.
Disclaimer: This analysis is for educational purposes only based on technical chart patterns and indicators. It does not constitute personalized financial or investment advice.