
M
mrmadhusudanrawat• Sep 11, 02:44 AM
c/All About Indices
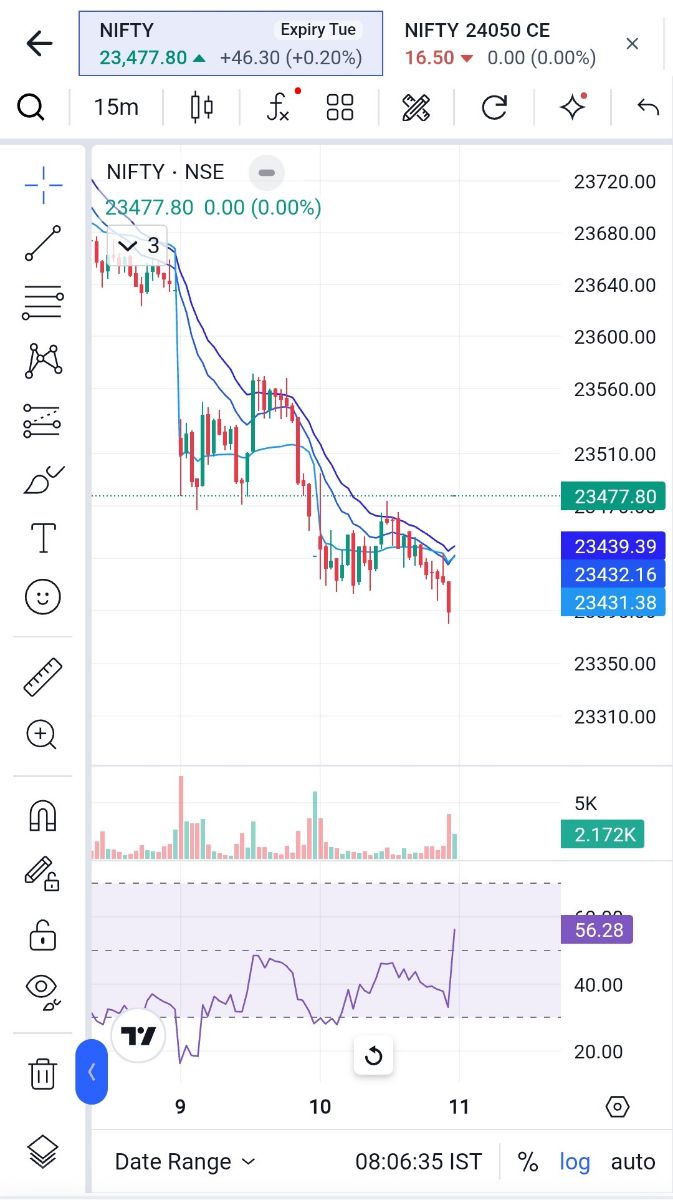
NIFTY Intraday View (15-Minute Chart) Trend: Bearish — the market is making low...
Enlarge Chart
NIFTY Intraday View (15-Minute Chart)
Trend: Bearish — the market is making lower highs and lower lows.
Today’s range: 23,300–23,480
Plan: Look for selling opportunities when the market moves up.
Avoid: Buying when NIFTY is trading in the middle of the range.
Short version:
NIFTY is bearish on the 15-minute chart. The range is 23,300–23,480. The preferred strategy is sell on rise and avoid buying in the middle of the range.